Enterprise Payments Resilience: Key Findings from BR-DGE’s 2025 Merchant Survey
Payments Resilience: Enterprise
E-commerce Insights 2025
When traffic surges or a payments provider stumbles, weak points show: at checkout, in approval rates, and in the backup routes merchants rely on.
To help enterprise e-commerce teams benchmark their setup and improve performance, BR-DGE commissioned independent research with Censuswide.
We surveyed 50 enterprise e-commerce decision-makers across retail, travel, digital services and gaming. The findings show how merchants handle outages, automatic switchover to a working route, routing choices, tokenisation and international expansion - and where current setups are still slowing them down.
Survey by Censuswide, 3–9 October 2025, MRS/ESOMAR standards; 50 enterprise e-commerce decision-makers (18+).
Please note: Questions marked with * allowed multiple selections.
Payment methods and providers
Payment methods supported across markets
How many payment methods do merchants support?
- 46% support 6 to 10 payment methods
- 32% support 1 to 5 payment methods
- 22% support 11 to 20 payment methods
- 0% support more than 20 payment methods
Most merchants support 6-10 payment methods
Having more than one payment method supports localisation and customer preference across markets. Value comes from how well methods are routed, not just the count.
Payment providers in use across markets
How many processors/acquirers do merchants work with?
- 38% use 2 to 3 providers
- 38% use 4 to 5 providers
- 20% use 6 to 7 providers
- 4% rely on a single provider
Most merchants work with 2 to 5 providers
Working with multiple providers spreads risk, but without smart routing or backup coverage, that flexibility can still leave merchants exposed.
Routing concentration
For merchants using more than one provider, what percentage of their transaction volume is typically routed through their primary acquirer?
route 50-70% of transactions through their primary processor
route 71-90% of transactions through their primary processor
route less 50% of transactions through their primary processor
Most merchants route 50-70% of transactions through their primary provider
Even with multiple providers, most merchants concentrate volume through a single processor, increasing risk if that route fails.
By sector
Merchants routing 50-70% of online transactions through their primary processor by sector:
- Digital goods - 73%
- Food delivery - 56%
- Gaming companies - 75%
- Homeware & lifestyle - 86%
- Subscriptions - 50%
- Travel & transit - 86%
By annual online volume
- 100% of surveyed merchants with an annual volume of £300m–£499.99m route 50-70% of online transactions through their primary processor
- 50% of surveyed merchants with an annual volume of £500m+ route 71%-90% of their transactions through their primary processor
By company turnover
- 60% of surveyed merchants with an annual turnover of £500m+ route 71%-90% of online transactions through their primary processor
The largest merchants are concentrating the most volume, and risking the most.
Routing optimisation and backup coverage
Routing optimisation strategies in use
How do merchants optimise routing across providers?*
- 62% use manual or rule-based optimisation
- 38% use AI/ML optimisation
Most merchants use rule-based or manual routing; fewer use AI/ML
- 100% of travel & transit companies use manual optimisation
- 50% of gaming companies use AI/ML
- 71% of homeware & lifestyle companies use both rule-based and manual
Routing is still largely manual or rule-based, leaving gaps in responsiveness when conditions change.
Automated backup coverage between providers
Do merchants have automated, real-time failover?
- 32% have automated backup in place
- 42% have only partial failover
- 18% have no automated failover in place
- 8% are unsure
Only 32% of merchants have full automated backup routing between providers
- 67% of food delivery companies have automated failover
- 43% of subscription companies have no automated failover
- 71% of travel & transit companies have only partial failover
Most merchants lack comprehensive automated backup coverage, resulting in routing gaps that persist across markets and providers.
Revenue impact and expansion delays
Revenue impact from payment outages
How much have payment outages cost merchants in the past 2 years?
- 92% of merchants experienced outages or disruptions in the past 2 years
- 88% can quantify the impact:
- 50% report losses of £1.1m to £10m
- 34% report losses of £100k to £1m
- 4% report losses over £10m
- Only 8% say they experienced no outage
Most merchants report £100k to £10m in outage-related losses over past 2 years
Outages are widespread, and most merchants can quantify the cost, often in the millions.

Expansion delays caused by payment limitations
How have payment limitations held back market expansion?
- 54% say expansion was prevented or delayed
Over half of merchants say payments have delayed expansion into new markets
- 100% of food delivery merchants report delays
- 75% of gaming merchants report delays
- 71% of subscription merchants report no impact
- 57% of travel & transit merchants are unsure
Payment limitations are holding back growth, especially for high-volume and single-market merchants.
Tokenisation strategies in use
How do merchants tokenise payment credentials, and where do the gaps remain?
use tokenisation in some form
do not use tokenisation
use fully interoperable token vaulting
Of the merchants that use tokenisation in some form, the split looks like this:
use PSP-only tokens
use both PSP and network tokens
use network tokens
Most merchants use tokenisation, but network token adoption varies widely by sector and volume.
Sector signals:
- 88% of digital goods merchants use tokenisation
- Subscription businesses show lowest adoption at 43%
- Gaming merchants are split: half use PSP-only tokens
Volume signals:
- 100% of surveyed £500m+ merchants use network tokens
- 18% of mid-market (£50m-£69.99m) merchants report no tokenisation: the highest ‘no’ rate
Tokenisation is widespread, but many merchants still rely on PSP-only models, limiting portability, resilience, and long-term control.
Expansion challenges and strategy drivers
Challenges when expanding payments internationally
What holds merchants back when scaling payments across borders?*
- 44% cite technical integration as the top hurdle
- 30% name partner relationships
- 22% report regulatory compliance
Technical integration is the most common challenge, especially for multi-market and European merchants
Sector signals:
- 57% of homeware & lifestyle merchants cite technical integration
- 43% of travel & transit merchants cite regulatory compliance
- Food delivery companies are evenly split across all three challenges

Market signals:
- 67% of multi-market global merchants cite technical integration
- 45% of multi-market European merchants cite partner relationships
- 44% of single-market international merchants cite partner relationships
Integration and partnerships are the biggest blockers to international scale, especially for multi-market merchants.
Top drivers of payment strategy for the next 2 years
What is shaping merchants' priorities?*
- 58% cite customer experience
- 54% cite cost optimisation
- 40% cite new market expansion
- 28% cite resilience and continuity
Customer experience and cost optimisation lead the agenda, but expansion and resilience still matter
Sector signals:
- 86% of subscription businesses prioritise customer experience
- 71% of travel & transit merchants prioritise expansion
- 63% of digital goods merchants prioritise cost optimisation
Volume signals:
- £10m-£29.99m merchants prioritise cost optimisation and resilience
- £500m+ merchants split evenly across experience, cost, and expansion
- £50k+ average-transaction merchants prioritise customer experience and expansion
Merchants are focused on smoother customer journeys and lower costs, but resilience and expansion remain key for growth.
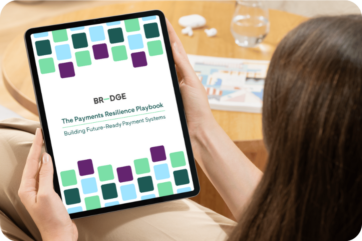
The Payments Resilience Playbook
The BR-DGE Payments Resilience Playbook helps enterprise merchants fix the issues that cost revenue - from failed checkouts to siloed tokens to stalled innovation.
Following the issues highlighted by our research, the playbook breaks down real merchant examples, and practical solutions to strengthen coverage, deploy intelligent routing, and continually improve performance without disruption.
Together, we address five core themes of modern payments resilience:
Redundancy: avoiding single points of failure
Flexibility: building a stack that evolves with your business
Interoperability: connecting systems that work in harmony
Optimisation: using data to keep improving
Future-readiness: adapting fast to what comes next
Discover how leading merchants are turning resilience into the competitive advantage
Discover more from BR-DGE